Fork me on GitHub

Sunday, December 20, 2009

Trying to take a family Christmas Photo

Snoopy does NOT want to be in the family Christmas photo!
Posted by Picasa

Thursday, December 17, 2009

Boiler "hacking" - what's going on with my aquastat?

I'm trying to figure out how to correct and improve my Slant/Fin boiler.

It appears that after:

  1. Performing the yearly maintenance service (under contract with our Oil Delivery company)
  2. Replacing our old SuperStor SS-40 with a SuperStor Ultra SSU-45 (due to a slowly leaking tank in the original SS-40)
  3. Switching the Taco SR503 Switching Relay to add priority back to Zone 1 (the circulator that heats the SuperStor)
The boiler began to exceed 30psi... I didn't notice this until I came down one morning and noticed water on the floor around the pressure relief valve discharge pipe.

After this I began to pay more attention and notice that the boiler would reach almost 30psi while running for a while, it would also reach just over 200 degrees Fahrenheit.

I had the plumber who replaced the SuperStor come back out, and he replaced the expansion tank...
...at the same time, I noticed the temperature reaching almost 210. I changed the Hi setting on the Honeywell Aquastst to 160 (from 180) This prevented the temperature from exceeding 200, but it would still get close to 200 (I will have to pay closer attention now).

Given the settings of the SR503 (Zone1 Priority for the SuperStor):

From furnace

From furnace


What should the Honeywell Aquastat be set to, and why would it not match the temperature gauge directly above it (e.g. when Hi was set to 180 and Differential to 10, the temp would still go above 200):

From furnace


Click below to go to the album page and see all of the pictures of my boiler, circulators, SuperStor, etc...:

furnace

Wednesday, September 30, 2009

Project Server Data Analysis View Issues

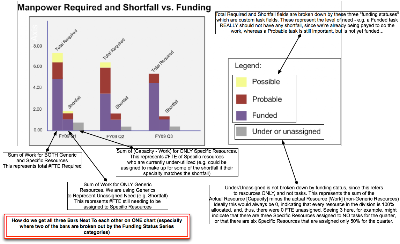
The following image shows a rough mock-up of the chart I would like to make with explanations of each field:


To explain further, I can't figure out how to show the three different bar charts, where two are broken down (and stacked) by Funding Status, on a single chart.
- I found these resources on how to accomplish this in Excel, but do not know how to translate it to Data Analysis View.
"How to create charts with multiple groups of stacked bars in Excel"
http://peltiertech.com/Excel/ChartsHowTo/ClusterStack.html
http://people.stfx.ca/bliengme/ExcelTips/Columns.htm
http://support.microsoft.com/kb/214119

Also, I created a new MDX Expression 'Availability FTE' as: ([Measures].[Capacity] - [Measures].[Work]) / 520
- this might be able to represent the 'Under or unassigned' bar if it can be filtered to only be non-Generic
Unfortunately, as described above, I have no idea how to add it as a third bar on the chart.

The following is a screen shot of my best attempt so far:


If there were a way to plot the highlighted 'Resource Is Generic' Total (in addition to True and False) I'd be a little closer
- Still need to add availability.
- If I drag Availability in next to FTE, it gets stacked on-top of FTE, rather than placed as a new bar to the right of FTE (as I would want)...

UPDATE: I was able to accomplish this by referencing the cells from three different Excel exported pivot tables... the down-side to this is that it is not very user-friendly (e.g. if date ranges are changed in one pivot table, they must be changed in all tables, not to mention missing data for various date ranges is very difficult to deal with when referencing cells)